Use Instagram To Improve Traffic and Marketing
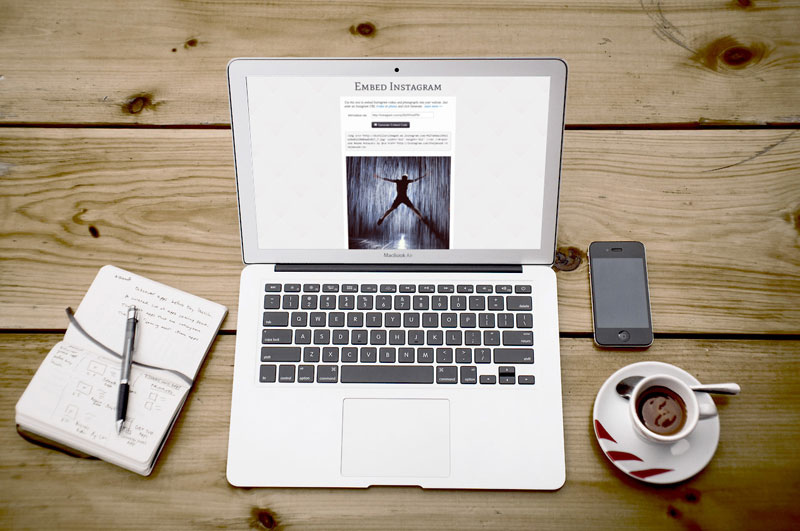
Does your fashion world have Instagram business account? Are you wondering on ways to analyze Instagram activities? You have to discover ways to use Instagram insights for evaluating followers, stories, posts and promotions. But, there is always a quite major point for you to consider whenever the matter involves Instagram Insights. You can try growing your followers for Instagram once you are sure of the points involved in this regard. The more you get the better results you are likely to address so far.
Table of Contents
More about the Instagram Insights:
Instagram Insights is always stated to be a native analytics tool, which helps in providing data to follower actions and demographics and also dealing with the content in this regard. This information is designed to make it super easy to just compare content, measure the campaigns and see how these individual posts are actually performing over here.
- For accessing some of the best IG insights, you are always in need of a business account. If you ever convert personal account to any of the business one, you will easily get to check the insights for the content that will be posted after you will make the right switch over here.
- If any point you can switch the business account right back to personal one, you might lose all of the insights data. You can easily find the Insights data in three of the various places in the IG app. For accessing insights from the current account page, you can tap the bar graph icon, available at the upper right side of the screen.
- For checking out on the analytics for individual post, you can easily navigate to the post and then you can tap on the View Insights available in bottom left side of the corner. To check out the data for the story, you can open story and then tap the current names available in bottom left side of the corner.
Focusing More Towards The Insights Homepage:
The current Insights homepage is here to offer summary of the data for the content that you have posted in last 7 days. In the current top section, you can easily find out the total followers that you have and the number you have already gained in past 7 days. You can even get the chance to view the number of posts. That you have on account and how many you have already added in previous week.
You can easily scroll down for checking out the series of the bar graphs. Which can otherwise reveal the entire reach, impressions and even profile views for the last 7 days. You can easily swipe to check out the website clicks and even the CTA button clicks, like email, calls and directions. Once you can access the IG insights, you can find out the data that actually matters more to business.
Explore The Current Follower Demographics And The Behavior
On the current Insights homepage, you can easily scroll down to Followers section and check out on the summary of follower demographics. That will include age group, gender and even location. Now, as you need around 100 followers to the minimum to see the data demographics, so you have to work out accordingly.
- You can click on the button which states “Tap See More” for opening a page with the graphs, which will otherwise break down the follower demographics well in details. You can easily segment the data in following options like age range, gender, top locations and even online times.
- This information will help you to understand the followers better and where they are actually from so that you can easily access if you want to reach target audience on platform.
- Along with that, the insights can always inform IG ad targeting. If you are willing to reach audience similar to followers, you can target the demographic of present audience.
- Right at bottom of Followers section, you can easily find two graphs which can easy showcase when the followers are most and highly active on network. In the first ever graph created, you will find out more about the followers, who are online on a daily basis.
- After that, you can check out on the second graph, where you get the chance to discover the number of days these followers are most likely to be online. Moreover, you can try looking for patterns in times and days when the followers are online.
It depends on when you can actually post content at times whenever you will maximize engagement and reach. On the other hand, you can easily create posting schedule that will best reflect whenever the audience is online.
You Can Even View Data For The Posts
Instagram will always let you view the data for the multiple posts once or just delve right into metrics for the individual post. If you want, you can filter the post data by type, content, timeframe and metric.
- The current posts section of insight homepage will be the one to showcase three major and the most recent posts. You can click on “tap see more” for checking out on the added posts.
- Just by default, the posts section shows total number of the said impressions for all of posts in the said past year.
- For just segmenting this data, you can always tap any of blue links at top of the page. And then can choose from these said filters. You can check on the content type, measurements and times.
- The filters will further let you zero on important data for measuring campaigns, goals and some of the best performing content.
The goals are to be measured for a particular time frame. Those goals will definitely include engagement, ratio of engagement that you can reach, impressions and reach, and even the best and worst performing content types. For measuring the campaign goals, you can easily filter data by timeframe and get the chance to identity content type as posted.

